The great thing about AlgoCloud is that you don’t need to know how to program. All codes can be written in a simple way that even a complete beginner can understand. Today, I’m going to show you how to create a mini portfolio with just one simple condition.
Breakout strategies are one of the basic strategies used in trading. The logic of such a strategy is that the price moves for some time within a certain channel or under strong resistance. Once the price breaks this resistance or channel, it is speculated that the movement will be quite strong for some time.
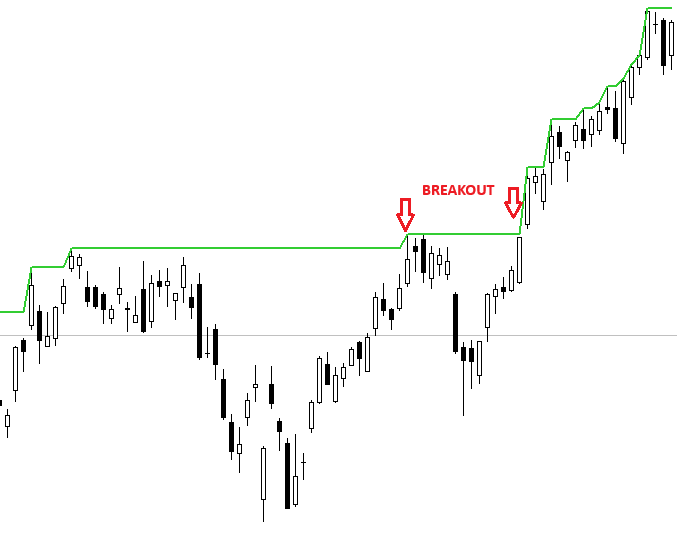
Sample breakout strategy on the MSFT market
The entry point for such a strategy will be when the closing price crosses the highest high of the last 200 days:
Close > HighestHigh(H, 200)
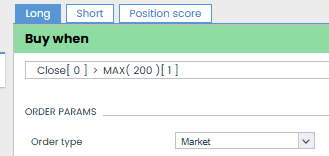
We will enter at the closing price before the stock market closes at the market price. So we set the entry trigger to OnBarClose.
Since we will be entering after the close of the current day, we must set the Shift value to 0 (Close[0]). We calculate the highest high using the function (MAX) for the highest value over a specified period.
We will trade the strategy on index shares of the S&P 500, which consists of 500 shares. We will set the maximum number of open positions to 5 and filter them based on the evaluation using the ROC function.
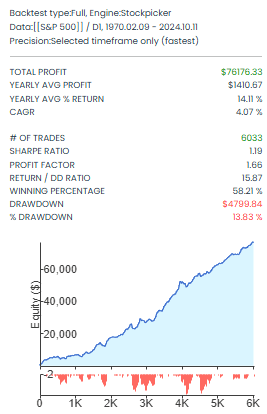
We will try 4 output variants:
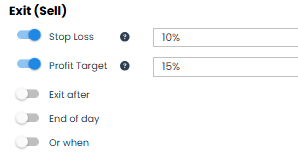
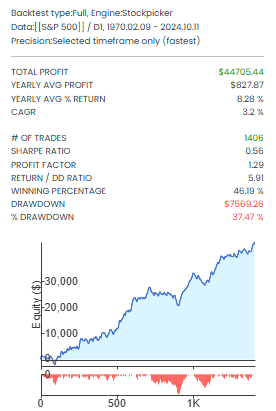
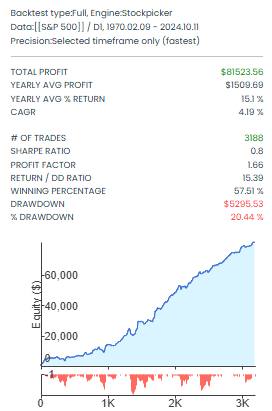
The backtest shows that the price breakout idea has its edge and the strategy is profitable, with a total profit of more than $44,000. Other parameters also look promising (profit factor, RET/DD, Win%, %Drawdown).
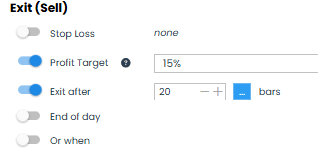
In the next variant, we will keep the ProfitTarget and instead of the StopLoss, we will implement an exit after 20 bars. This means that if the price does not reach the ProfitTarget within 20 days, the position will be automatically closed after 20 days.
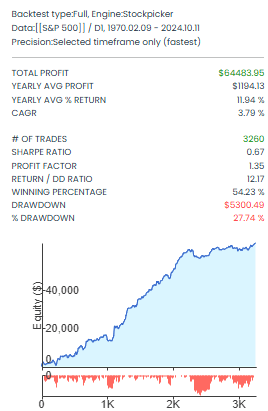
The second variant shows improvements in all metrics. The equity curve is smoother, and the total profit has increased. The ProfitFactor and RET/DD are also higher. The percentage of successful trades has jumped over 50%, and the Drawdown has fallen by almost 10%. A much better result.
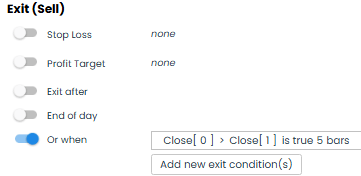
For Variant 03, we will drop the StopLoss and ProfitTarget completely. We will let the strategy run until the condition that the current Close is higher than the previous Close is fulfilled, a total of 5 times in a row. Since we can calculate the risk in advance with stocks, we don’t need to set a StopLoss and can let the strategy run freely to see what it can do.
As you can see, even without a StopLoss and ProfitTarget, the strategy is profitable. Moreover, the equity curve is even smoother than in the previous case, and all other metrics have also improved. The %Drawdown dropped another 7%, which is great.
For the last variant, we will keep the exit condition the same as for the previous variant, with the only change being an increase in the maximum number of open positions from 5 to 10.
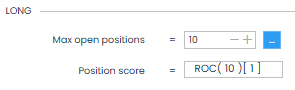
Here, you can see that even a small change can improve the strategy. Although we doubled the number of trades by doubling positions, this allowed us to spread the risk over more markets, slightly improving our Win% while mainly reducing the %Drawdown by another 7%.
Using this example, I wanted to show that creating a simple, profitable strategy is not that complicated. You don’t have to come up with complex codes, just one simple condition. Of course, you can improve your strategy with some filters based on price, volume or position score.
Metrics of individual strategies and the overall portfolio
As you can see, even this basic idea of the breakout strategy can be improved by trying different exit variants. Even with these small changes, we have effectively created 4 separate strategies that are not correlated with each other, except for variants 03 and 04, which are identical except for the number of positions. The correlation is much higher for these two variants.
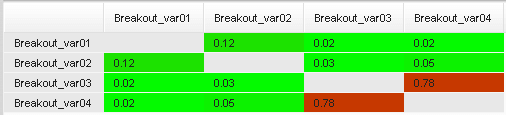
Mutual correlation of individual variants
We took a simple condition, tried 3 different types of exits, changed the maximum number of positions once, and created a mini-portfolio that you can start trading with a clear conscience.

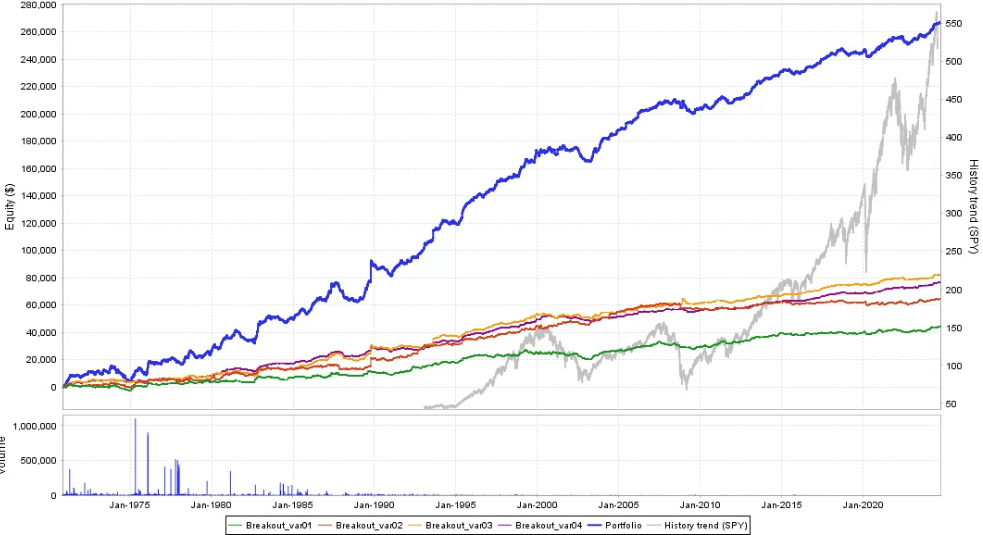
Portfolio equity
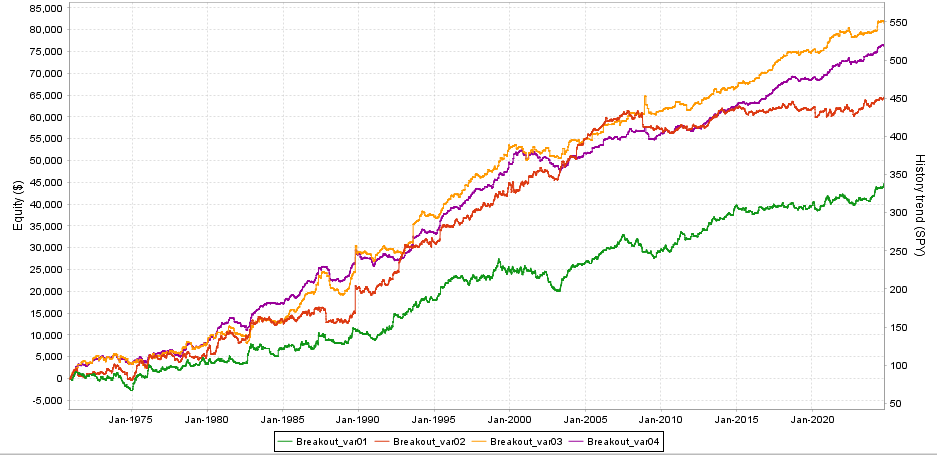
Comparison of equity curves of individual variants
I started like that too. I took the basic idea of the strategy, visualized it on a chart, and looked for ways to get the most out of it. I wrote simple code and tried different variations of outputs that made sense.
You can clone and right away start testing all strategies mentioned in the article here:
Next time, I will show you how to trade such a strategy in another way.
Libor
This website is operated by AlgoWizardCloud LLC.
AlgoCloud.com is a technology platform and publisher, not a registered broker-dealer or registered investment adviser, and does not provide investment advice.
Investing involves risk and investments may lose value. Risk capital is money that can be lost without jeopardizing ones’ financial security or life style. Only risk capital should be used for trading and only those with sufficient risk capital should consider trading. Past performance is not indicative of future results. Seek appropriate financial, taxation and legal advice before making any investments.
Risk Disclosure:
Trading contains substantial risk and is not for every investor. An investor could potentially lose all or more than the initial investment. Risk capital is money that can be lost without jeopardizing ones’ financial security or life style. Only risk capital should be used for trading and only those with sufficient risk capital should consider trading. Past performance is not necessarily indicative of future results.
Hypothetical Performance Disclosure:
Hypothetical performance results have many inherent limitations, some of which are described below. no representation is being made that any account will or is likely to achieve profits or losses similar to those shown; in fact, there are frequently sharp differences between hypothetical performance results and the actual results subsequently achieved by any particular trading program. One of the limitations of hypothetical performance results is that they are generally prepared with the benefit of hindsight. In addition, hypothetical trading does not involve financial risk, and no hypothetical trading record can completely account for the impact of financial risk of actual trading. for example, the ability to withstand losses or to adhere to a particular trading program in spite of trading losses are material points which can also adversely affect actual trading results. There are numerous other factors related to the markets in general or to the implementation of any specific trading program which cannot be fully accounted for in the preparation of hypothetical performance results and all which can adversely affect trading results.
Risk Disclosure:
Broker disclaimer:
Interactive Brokers, Alpaca, XTB brokers are not affiliated with AlgoCloud.com and do not endorse or recommend any information or advice provided by AlgoCloud.com