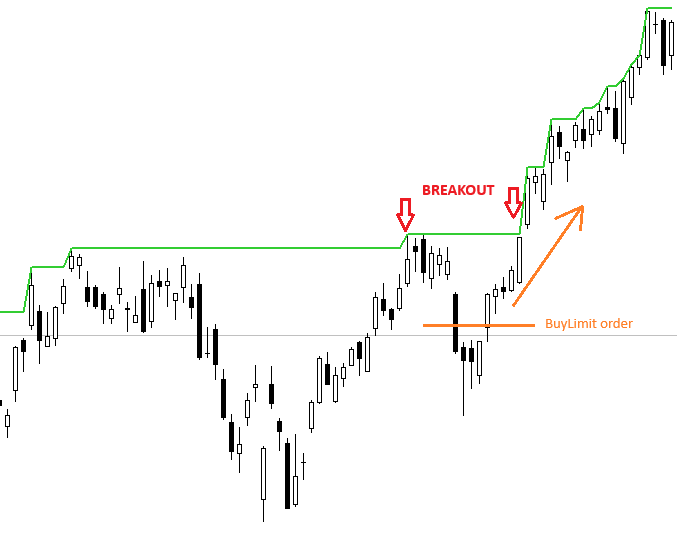

Price bounce from Limit order
Let’s revisit the strategy we developed last time. This time, however, we won’t buy immediately when the price breaks through resistance. Instead, we’ll place a Limit order at 2% below the broken resistance level.
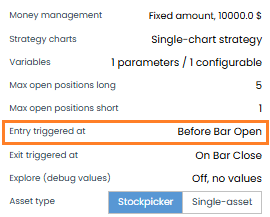
First, we’ll make a few changes:
Rather than entering at the Market price at the end of the day, we’ll calculate and place a Limit order before the market opens. Therefore, we need to change the input trigger to BeforeBarOpen.
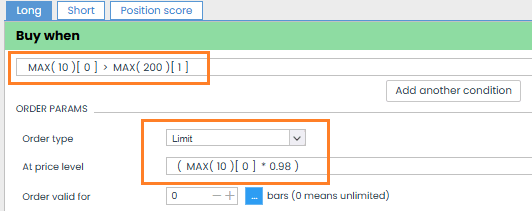
Finally, we need to update the input condition and order type. We’ll only place an entry order if a breakout has occurred within the past 10 days:
HighestClose(C, 10) > HighestHigh(H, 200)
During these 10 days, the entry price will be calculated as the highest Close minus 2%:
HighestClose(C, 10) – 2%
Here is the AlgoCloud writeup:
Today, I won’t test all the variations of the original strategies from the previous article. Instead, we’ll focus on testing variants 01 and 03 as a representative sample.
We’ll execute the same setup as in the original breakout strategy variant 01:
– ProfitTarget 15%
– StopLoss 10%

Compared to the original strategy, the profit fell by half, but the number of trades decreased by nearly 80%. This means the profit per trade has increased significantly, with other metrics also showing improvement. For instance, the drawdown dropped by almost half compared to the original strategy.
This demonstrates that fewer trades can lead to better results.
| Strategy type | Variant | # trades | Total Profit | CAGR | Profit Factor | Ret/DD | Win % | DD % |
| Breakout | VAR 1 | 1406 | $44 705,00 | 3,2 | 1,29 | 5,91 | 46,19 | 37,47 |
| Breakout Limit | VAR 1 | 334 | $21 183,00 | 2,13 | 1,67 | 8,35 | 51,5 | 19,98 |
Now, let’s examine the results with the new strategy using the output conditions from variant 03 of the original strategy. We’ll execute based on the condition that the Close price has been greater than the previous day’s for 5 consecutive days:
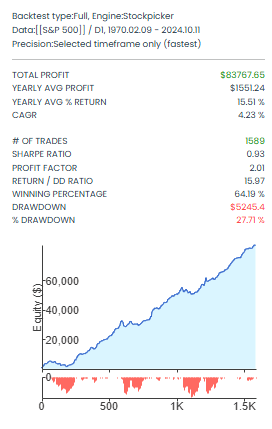
Compared to the original strategy, %Drawdown has increased slightly. However, we have half the trades, and the profit is almost identical. Even better, all other indicators have significantly improved—the Profit Factor is 2.01, and Win% is over 64%, which is excellent.
Finally, we’ll test the same strategy but this time using volatility-based entry rather than a percentage-based Limit order. Here, we set the Limit order at:
HighestClose(C, 10) – 1.5 * ATR(5)
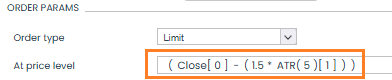
The exit remains the same as in the previous version.
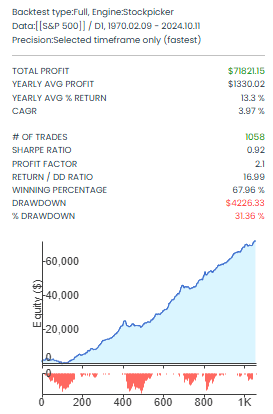
In this last example, the %Drawdown increased slightly, and profit decreased, but the number of trades is again smaller, and the other indicators have continued to improve. The equity curve is much smoother as a result.
| Strategy type | Variant | # trades | Total Profit | CAGR | Profit Factor | Ret/DD | Win % | DD % |
| Breakout | VAR 3 | 3188 | $81 523,00 | 4,19 | 1,66 | 15,39 | 57,51 | 20,44 |
| Breakout Limit | VAR 3A | 1589 | $83 767,00 | 4,23 | 2,01 | 15,97 | 64,19 | 27,71 |
| Breakout Limit | VAR 3B | 1058 | $71 821,00 | 3,97 | 2,1 | 16,99 | 67,96 | 31,36 |
Comparison of all Variant 03 strategies
In today’s article, I wanted to show an alternative approach to trading breakout strategies that minimizes “fakeouts,” reduces the number of trades and commission costs, and increases the success rate.
In some cases, Drawdown has increased slightly because we haven’t yet applied a simple filter to remove non-trending trades. In trading, there’s always a trade-off.
This is another valuable piece in our trading portfolio puzzle.
Next time, we’ll introduce another method for trading stocks, including drawdown filters, and update our portfolio.
Libor Štěpán
This website is operated by AlgoWizardCloud LLC.
AlgoCloud.com is a technology platform and publisher, not a registered broker-dealer or registered investment adviser, and does not provide investment advice.
Investing involves risk and investments may lose value. Risk capital is money that can be lost without jeopardizing ones’ financial security or life style. Only risk capital should be used for trading and only those with sufficient risk capital should consider trading. Past performance is not indicative of future results. Seek appropriate financial, taxation and legal advice before making any investments.
Risk Disclosure:
Trading contains substantial risk and is not for every investor. An investor could potentially lose all or more than the initial investment. Risk capital is money that can be lost without jeopardizing ones’ financial security or life style. Only risk capital should be used for trading and only those with sufficient risk capital should consider trading. Past performance is not necessarily indicative of future results.
Hypothetical Performance Disclosure:
Hypothetical performance results have many inherent limitations, some of which are described below. no representation is being made that any account will or is likely to achieve profits or losses similar to those shown; in fact, there are frequently sharp differences between hypothetical performance results and the actual results subsequently achieved by any particular trading program. One of the limitations of hypothetical performance results is that they are generally prepared with the benefit of hindsight. In addition, hypothetical trading does not involve financial risk, and no hypothetical trading record can completely account for the impact of financial risk of actual trading. for example, the ability to withstand losses or to adhere to a particular trading program in spite of trading losses are material points which can also adversely affect actual trading results. There are numerous other factors related to the markets in general or to the implementation of any specific trading program which cannot be fully accounted for in the preparation of hypothetical performance results and all which can adversely affect trading results.
Risk Disclosure:
Broker disclaimer:
Interactive Brokers, Alpaca, XTB brokers are not affiliated with AlgoCloud.com and do not endorse or recommend any information or advice provided by AlgoCloud.com